Elaboração de mapas de distribuição de espécies em R
Comandos básicos para você preparar seu próprio mapa
Dr. Ricardo Perdiz | 21--22 Out 2021 | Dia 02

COVID19
1 / 36
COVID19
Recuperando todo nosso trabalho de ontem
# Carrega o pacotelibrary("maps")# Importa os dadosprotium <- read.table( file = url( "https://raw.githubusercontent.com/ricoperdiz/Tutorials/master/R_make_a_map/dados.csv" ), header = TRUE, as.is = TRUE, sep = '\t', dec = '.' )# Cria variaveisspp <- unique(protium$Species)cores.map <- ifelse(protium$Species == spp[1], 'red','black')5 / 36
COVID19
Variáveis - Cria um vetor de tamanho para cada espécie
Esse vetor é atribuído a uma coluna do conjunto de dados protium.
Protium heptaphyllum possui uma distribuição mais ampla, por isso atribuo um tamanho menor pra ela.
protium$cex.p <- ifelse(protium$Species == spp[1], 1, 0.8)6 / 36
COVID19
Variáveis - Vetor contendo dados de latitude e longitude em objetos separados
lat <- protium$decimalLatitudehead(lat)## [1] -2.31537 -3.18524 -0.57000 -0.57000 0.30000 6.42000long <- protium$decimalLongitudehead(long)## [1] -59.6855 -60.1302 -72.1300 -72.1300 -66.7000 -67.42007 / 36
COVID19
Variáveis - Vetores contendo amplitude de latitude e longitude
# amplitude de lat e long para lat e longrange(lat)## [1] -25.50 10.18y1 <- range(lat) + c(-1,1)y1## [1] -26.50 11.18range(long)## [1] -77.9436 -34.8631x1 <- range(long) + c(-1,1)x1## [1] -78.9436 -33.86318 / 36
COVID19
Variáveis - Vetor para os símbolos de cada espécie
Dúvidas, executar ?points no R e verificar as formas de pontos atribuídas a cada número.
protium$pontos <- ifelse(protium$Species == "Protium aracouchini", 21, 24)head(protium$pontos)## [1] 21 24 21 21 21 249 / 36
COVID19
Variáveis - Vetor nomes de países da região Neotropical
paises <- c('Brazil','Argentina','Peru','Paraguay','Ecuador','Chile','Uruguay','French Guiana','Suriname','Venezuela','Colombia','Guyana','Bolivia','Panama','Costa Rica')paises## [1] "Brazil" "Argentina" "Peru" "Paraguay" ## [5] "Ecuador" "Chile" "Uruguay" "French Guiana"## [9] "Suriname" "Venezuela" "Colombia" "Guyana" ## [13] "Bolivia" "Panama" "Costa Rica"10 / 36
COVID19
Plota o mapa - Mapa base
maps::map(regions = paises, fill = FALSE, xlim = x1, ylim = y1)
12 / 36
COVID19
Pontos de ocorrencia de cada espécie
maps::map(regions = paises, fill = F, xlim = x1, ylim = y1)points(long,lat, pch = protium$pontos, col = cores.map, bg = cores.map, cex = protium$cex.p)
13 / 36
COVID19
Coloca eixos das coordenadas
maps::map(regions = paises, fill = F, xlim = x1, ylim = y1)points(long,lat, pch = protium$pontos, col = cores.map, bg = cores.map, cex = protium$cex.p)map.axes()axis(side=4,las=1)axis(side=3,las=1)
14 / 36
COVID19
Coloca escala do mapa
maps::map(regions = paises, fill = F, xlim = x1, ylim = y1)points(long,lat, pch = protium$pontos, col = cores.map, bg = cores.map, cex = protium$cex.p)map.axes()axis(side=4,las=1)axis(side=3,las=1)par(cex=1, las=1)map.scale(max(long) - 12, ratio = F, cex = 1, metric = T)
15 / 36
COVID19
Plota a linha do equador
maps::map(regions = paises, fill = F, xlim = x1, ylim = y1)points(long,lat, pch = protium$pontos, col = cores.map, bg = cores.map, cex = protium$cex.p)map.axes()axis(side=4,las=1)axis(side=3,las=1)par(cex=1, las=1)map.scale(max(long) - 12, ratio = F, cex = 1, metric = T)abline(h=0,lwd=0.5,lty="dotted")
16 / 36
COVID19
Nomeia a linha do equador
maps::map(regions = paises, fill = F, xlim = x1, ylim = y1)points(long,lat, pch = protium$pontos, col = cores.map, bg = cores.map, cex = protium$cex.p)map.axes()axis(side=4,las=1)axis(side=3,las=1)par(cex=1, las=1)map.scale(max(long) - 12, ratio = F, cex = 1, metric = T)abline(h=0,lwd=0.5,lty="dotted")text(x = max(long) - 1, y = 1,labels="Equador", cex=1, adj=c(1,0.5))
17 / 36
COVID19
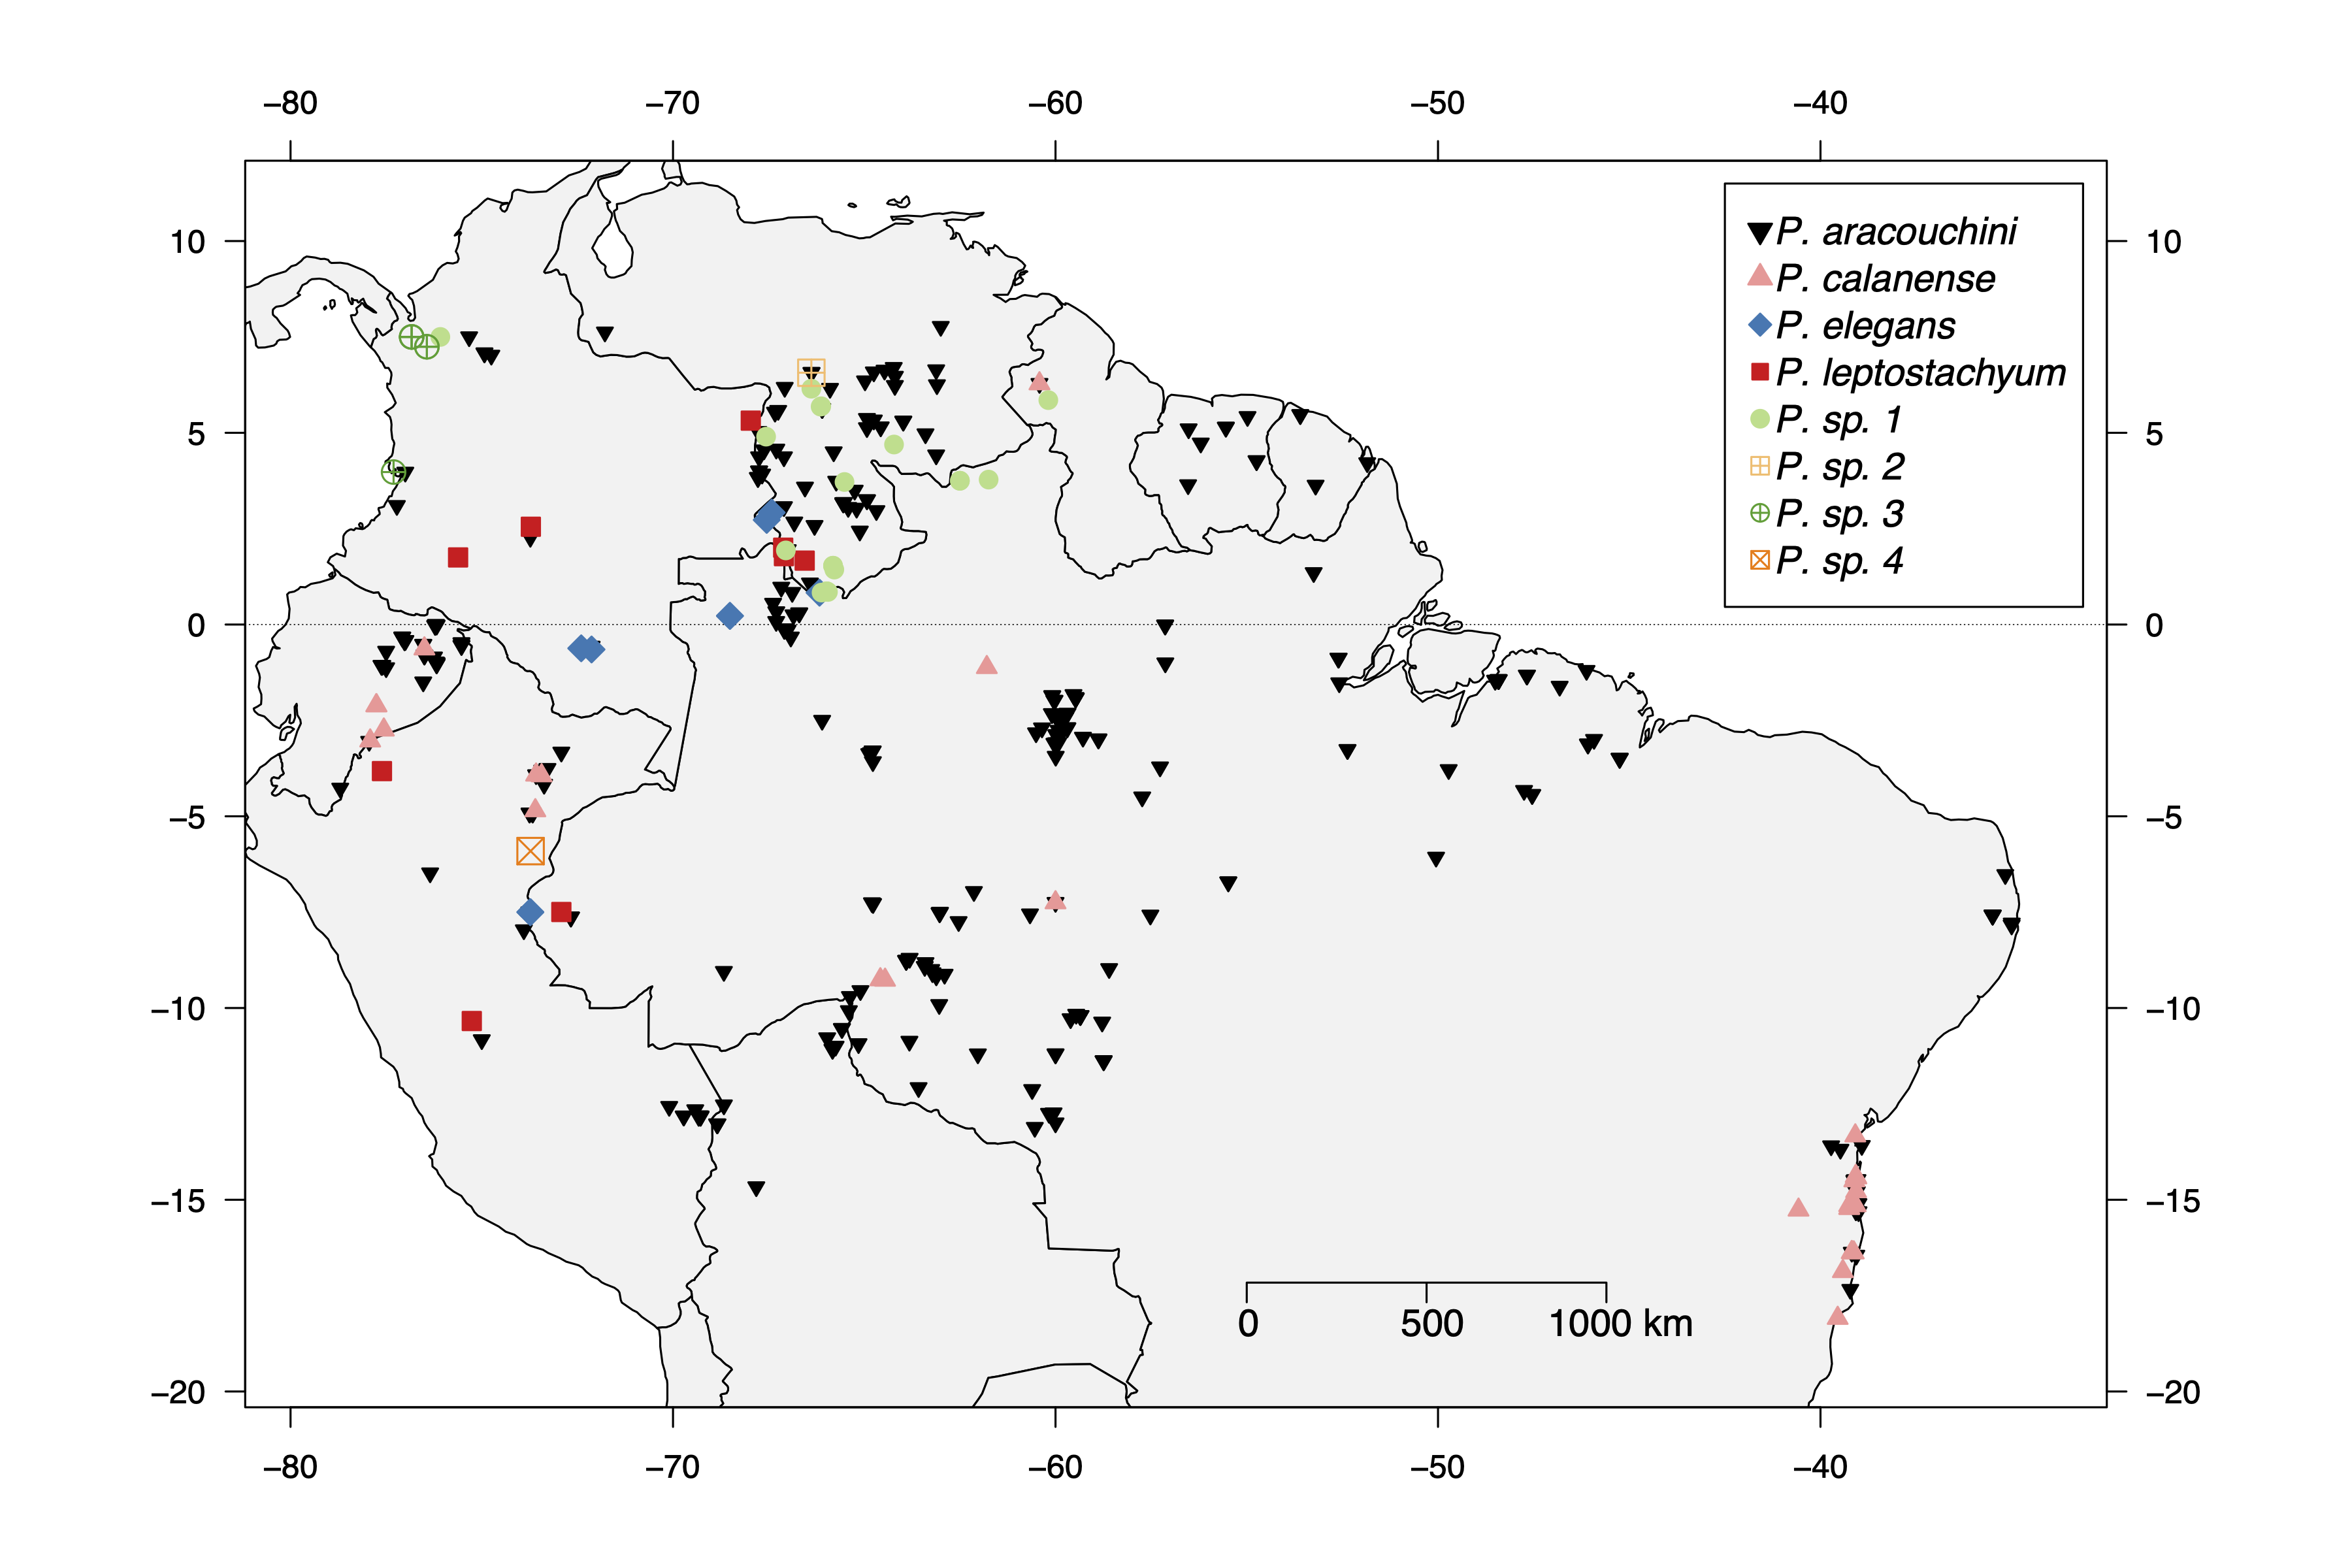
Plota uma legenda
maps::map(regions = paises, fill = F, xlim = x1, ylim = y1)points(long,lat, pch = protium$pontos, col = cores.map, bg = cores.map, cex = protium$cex.p)map.axes()axis(side=4,las=1)axis(side=3,las=1)par(cex=1, las=1)map.scale(max(long) - 12, ratio = F, cex = 1, metric = T)abline(h=0,lwd=0.5,lty="dotted")legend(max(long) - 16 , max(lat),legend = spp, pch = unique(protium$pontos), pt.bg = unique(cores.map), cex = 0.8, x.intersp = 0.8, text.font = 3)
18 / 36
COVID19
E se eu quiser salvar o mapa em um pdf, como eu faço?
pdf('meu_mapa_complexo_protium_aracouchini_e_heptaphyllum.pdf',height=8,width=10)maps::map(regions = paises, fill = F, xlim = x1, ylim = y1)points(long,lat, pch = protium$pontos, col = cores.map, bg = cores.map, cex = protium$cex.p)map.axes()axis(side=4,las=1)axis(side=3,las=1)par(cex=1, las=1)map.scale(max(long) - 12, ratio = F, cex = 1, metric = T)abline(h=0,lwd=0.5,lty="dotted")text(x = max(long) - 1, y = 1,labels="Equador", cex=1, adj=c(1,0.5))legend(max(long) - 16 , max(lat),legend = spp, pch = unique(protium$pontos), pt.bg = unique(cores.map), cex = 0.8, x.intersp = 0.8, text.font = 3)dev.off()19 / 36
COVID19
Checagem e limpeza de dados
Uma pequena demonstração de como faço uma limpeza superficial de dados utilizando o pacote dplyr
Aprenda mais em ->->->Usando o dplyr<-<-<-!
25 / 36
COVID19
Checagem de dados - 01
library("dplyr")## ## Attaching package: 'dplyr'## The following objects are masked from 'package:stats':## ## filter, lag## The following objects are masked from 'package:base':## ## intersect, setdiff, setequal, uniondad_pre <- read.table( file = url( "https://raw.githubusercontent.com/ricoperdiz/Tutorials/master/R_make_a_map/nybg_paracouchini.csv" ), header = TRUE, as.is = TRUE, sep = '\t', dec = '.' )head(dad_pre)## id institutionCode## 1 928940c3-fd41-4d3e-92ff-333b661e8149 NY## 2 7bb25ac9-f899-428c-b8f5-2b5b4cd16317 NY## 3 15dc67bf-c1df-44d5-9112-30fa5e424466 NY## 4 12a00cca-9459-4c26-8ffd-673f2a675427 NY## 5 ef9d56c1-096b-409f-994e-612499591fb2 NY## 6 a0c243d9-a314-4be8-8be6-2ef925cb9bc1 NY## datasetName basisOfRecord catalogNumber recordedBy## 1 New York Botanical Garden S 1274378 A. Fernandez## 2 New York Botanical Garden S 1274415 Y. Fernandez## 3 New York Botanical Garden S 1274436 F. J. Breteler## 4 New York Botanical Garden S 1274394 B. G. Stergios D.## 5 New York Botanical Garden S 1274435 H. L. Clark## 6 New York Botanical Garden S 1274416 Y. Fernandez## recordNumber occurrenceDetails## 1 6921 http://sweetgum.nybg.org/vh/specimen.php?irn=1514785## 2 398 http://sweetgum.nybg.org/vh/specimen.php?irn=1515243## 3 4803 http://sweetgum.nybg.org/vh/specimen.php?irn=1515373## 4 15013 http://sweetgum.nybg.org/vh/specimen.php?irn=1515163## 5 7285 http://sweetgum.nybg.org/vh/specimen.php?irn=1515372## 6 448 http://sweetgum.nybg.org/vh/specimen.php?irn=1515246## eventDate continent country stateProvince county## 1 1990 South America Venezuela Amazonas Mun. Atabapo## 2 1989 South America Venezuela Bolívar Sucre## 3 1965 South America Venezuela Amazonas ## 4 1991 South America Venezuela Amazonas ## 5 1980 South America Venezuela Amazonas ## 6 1989 South America Venezuela Bolívar Sucre## locality## 1 Río Ocamo, Cerro Mawedi## 2 Peniplanicie y lomerios ubicados al sureste de Pie de Salto (Río Caura), aprox. a 20 en helicópt.## 3 Orinoco R. Southern part of Isla del Ratón## 4 Mision Río Mavaca## 5 San Carlos de Rio Negro, ca. 20 km S of confluence of Rio Negro and Brazo Casiquiare. Main study site, 4.3 km NNE on Solano road.## 6 Aprox. 70 km al SE de Hato la Vergareña.## minimumElevationInMeters maximumElevationInMeters decimalLatitude## 1 340 340 2.96667## 2 308 308 6.23000## 3 90 90 5.03000## 4 185 185 2.43333## 5 119 NA 1.93000## 6 293 NA 6.47000## decimalLongitude geodeticDatum coordinateUncertaintyInMeters## 1 -64.6833 NA## 2 -64.2000 NA## 3 -67.7700 NA## 4 -65.1167 Coordinates on label. NA## 5 -67.0500 Label NA## 6 -64.2000 Label NA## identifiedBy typeStatus scientificName kingdom## 1 D. C. Daly NA Protium aracouchini (Aubl.) Marchand Plantae## 2 D. C. Daly NA Protium aracouchini (Aubl.) Marchand Plantae## 3 D. C. Daly NA Protium aracouchini (Aubl.) Marchand Plantae## 4 A. Licata NA Protium aracouchini (Aubl.) Marchand Plantae## 5 D. C. Daly NA Protium aracouchini (Aubl.) Marchand Plantae## 6 N. Cuello A. NA Protium aracouchini (Aubl.) Marchand Plantae## phylum family genus specificEpithet infraspecificEpithet## 1 Magnoliophyta Burseraceae Protium aracouchini NA## 2 Magnoliophyta Burseraceae Protium aracouchini NA## 3 Magnoliophyta Burseraceae Protium aracouchini NA## 4 Magnoliophyta Burseraceae Protium aracouchini NA## 5 Magnoliophyta Burseraceae Protium aracouchini NA## 6 Magnoliophyta Burseraceae Protium aracouchini NA## taxonRank scientificNameAuthorship## 1 NA (Aubl.) Marchand## 2 NA (Aubl.) Marchand## 3 NA (Aubl.) Marchand## 4 NA (Aubl.) Marchand## 5 NA (Aubl.) Marchand## 6 NA (Aubl.) Marchand26 / 36
COVID19
Checagem de dados - 02
dad <- dad_pre %>% select(recordedBy, recordNumber, decimalLatitude, decimalLongitude, identifiedBy, specificEpithet) %>% arrange(recordedBy, recordNumber)head(dad)## recordedBy recordNumber decimalLatitude decimalLongitude identifiedBy## 1 NA NA ## 2 NA NA ## 3 NA NA ## 4 NA NA ## 5 NA NA ## 6 NA NA ## specificEpithet## 1 aracouchini## 2 aracouchini## 3 aracouchini## 4 aracouchini## 5 aracouchini## 6 aracouchini27 / 36
COVID19
Checagem de dados - 03
# + existência de valores vazios; em caso positivo, devemos eliminá-los;# + confiabilidade dos valores de latitude e longitude, às vezes, por diversos fatores, há troca de sinais (negativos e positivos) ocasionando equívocos quanto à ocorrência exata da amostra. Se for percebido algo assim, é bom checar os dados e buscar corrigí-los.# une os dados e passa para a proxima acaodados <- dad %>% #elimina os registros vazios de coletor filter(recordedBy != '') %>% #elimina os registros sem lat ou long filter(decimalLatitude != '' | decimalLongitude != '') %>% #filtra apenas os especimes identificados pelo especialista da família Burseraceae filter(identifiedBy == 'D. C. Daly')head(dados)## recordedBy recordNumber decimalLatitude decimalLongitude## 1 A. A. de Oliveira 278 -2.31537 -59.6855## 2 A. C. Londoño 1486 -0.57000 -72.1300## 3 A. C. Londoño 493 -0.57000 -72.1300## 4 A. C. Weber s/n 0.30000 -66.7000## 5 A. Dik 1579 -1.00000 -76.1800## 6 A. Dik 1606 -1.03000 -76.1800## identifiedBy specificEpithet## 1 D. C. Daly aracouchini## 2 D. C. Daly aracouchini## 3 D. C. Daly aracouchini## 4 D. C. Daly aracouchini## 5 D. C. Daly aracouchini## 6 D. C. Daly aracouchini28 / 36
COVID19
Checagem de dados - 04
#ha registros duplicados#busca-se entao apenas os dados unicos#limpa os dados de coletor e numero para poder criar um identificador#limpeza consiste em eliminar '.', espacos vazios, apostrofe e '_' duplosdados$recordedBy <- gsub('\\.', '_', dados$recordedBy) %>% gsub(' ', '_', .) %>% gsub("'", '_', .) %>% gsub('__', '_', .)head(dados$recordedBy)## [1] "A_A_de_Oliveira" "A_C_Londoño" "A_C_Londoño" ## [4] "A_C_Weber" "A_Dik" "A_Dik"29 / 36
COVID19
Checagem de dados - 05
#faz-se o mesmo para os numeros de coletadados$recordNumber <- gsub('/','_', dados$recordNumber) %>% gsub(' ', '_', .) %>% gsub('\\.', '_', .)head(dados$recordNumber)## [1] "278" "1486" "493" "s_n" "1579" "1606"30 / 36
COVID19
Checagem de dados - 06
#cria o identificador de coleta e especiearac <- dados %>% mutate( ID = paste(recordedBy,recordNumber, sep = '_'), Species = paste('Protium', specificEpithet, sep = ' '))arac$ID <- gsub('__','_',arac$ID)head(arac)## recordedBy recordNumber decimalLatitude decimalLongitude## 1 A_A_de_Oliveira 278 -2.31537 -59.6855## 2 A_C_Londoño 1486 -0.57000 -72.1300## 3 A_C_Londoño 493 -0.57000 -72.1300## 4 A_C_Weber s_n 0.30000 -66.7000## 5 A_Dik 1579 -1.00000 -76.1800## 6 A_Dik 1606 -1.03000 -76.1800## identifiedBy specificEpithet ID Species## 1 D. C. Daly aracouchini A_A_de_Oliveira_278 Protium aracouchini## 2 D. C. Daly aracouchini A_C_Londoño_1486 Protium aracouchini## 3 D. C. Daly aracouchini A_C_Londoño_493 Protium aracouchini## 4 D. C. Daly aracouchini A_C_Weber_s_n Protium aracouchini## 5 D. C. Daly aracouchini A_Dik_1579 Protium aracouchini## 6 D. C. Daly aracouchini A_Dik_1606 Protium aracouchini31 / 36
COVID19
Checagem de dados - 07
#quem sao os dados unicosunicos <- unique(arac$ID)head(unicos)## [1] "A_A_de_Oliveira_278" "A_C_Londoño_1486" "A_C_Londoño_493" ## [4] "A_C_Weber_s_n" "A_Dik_1579" "A_Dik_1606"32 / 36
COVID19
Checagem de dados - 08
#agora filtra os dados unicos no dataframe, eliminando os duplicados#faz-se uso da funcao match para obter esse resultadoprot_arac <- match(unicos, arac$ID) %>% dados[.,]head(prot_arac)## recordedBy recordNumber decimalLatitude decimalLongitude## 1 A_A_de_Oliveira 278 -2.31537 -59.6855## 2 A_C_Londoño 1486 -0.57000 -72.1300## 3 A_C_Londoño 493 -0.57000 -72.1300## 4 A_C_Weber s_n 0.30000 -66.7000## 5 A_Dik 1579 -1.00000 -76.1800## 6 A_Dik 1606 -1.03000 -76.1800## identifiedBy specificEpithet## 1 D. C. Daly aracouchini## 2 D. C. Daly aracouchini## 3 D. C. Daly aracouchini## 4 D. C. Daly aracouchini## 5 D. C. Daly aracouchini## 6 D. C. Daly aracouchini33 / 36
COVID19
Checagem de dados - 09
#verifica a cobertura de lat e long para ver se estao dentro# dos limites da America do Sullat <- range(prot_arac$decimalLatitude)long <- range(prot_arac$decimalLongitude)#aqui tem algo estranho#percebe-se aqui que ha valores que caem fora da Am Sul#limite e pouco mais de -80head(sort(prot_arac$decimalLongitude))## [1] -89.3000 -89.3000 -89.3000 -77.9436 -77.6200 -77.600034 / 36
COVID19
Checagem de dados - 10
#devemos eliminarprot_arac_limpo <- prot_arac %>% filter(decimalLongitude > -80)head(prot_arac_limpo)## recordedBy recordNumber decimalLatitude decimalLongitude## 1 A_A_de_Oliveira 278 -2.31537 -59.6855## 2 A_C_Londoño 1486 -0.57000 -72.1300## 3 A_C_Londoño 493 -0.57000 -72.1300## 4 A_C_Weber s_n 0.30000 -66.7000## 5 A_Dik 1579 -1.00000 -76.1800## 6 A_Dik 1606 -1.03000 -76.1800## identifiedBy specificEpithet## 1 D. C. Daly aracouchini## 2 D. C. Daly aracouchini## 3 D. C. Daly aracouchini## 4 D. C. Daly aracouchini## 5 D. C. Daly aracouchini## 6 D. C. Daly aracouchini35 / 36
COVID19
Grato!

Dúvidas? Entrem em contato!
@ricoperdiz
@ricoperdiz
ricardoperdiz.com
ricoperdiz@gmail.com
36 / 36


